| By selecting the Testing Set
Tab, you have full access to the testing samples. Here you can analyze, visualize, choose a smaller sub-set for testing, or change the data set altogether.
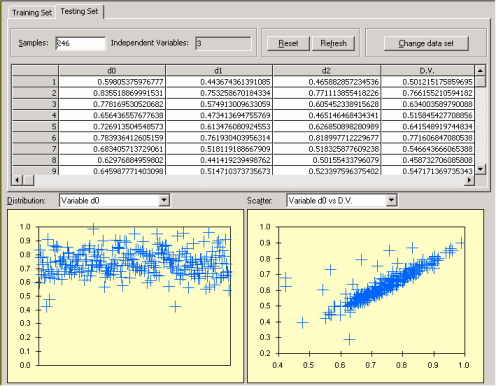
The data samples are shown on a spreadsheet for easy analysis and you can also use the plots at the bottom to analyze the distribution of all the inputs and to spot simple relationships between the independent variables and the dependent variable.
The visualization of both the distribution and relationships between variables is a valuable modeling tool as it can help you detect outliers or simple relationships between variables that can be used to evolve more efficient models.
|