| The algorithms of APS 3.0 used for Time Series Prediction
allow not only the evolution of models but also the use of these models to
make predictions. And
you make predictions in the Predictions Panel.
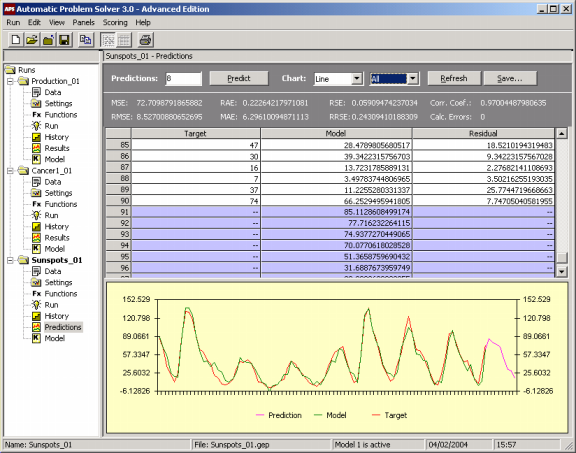
APS 3.0 allows you to make two kinds of predictions: one for testing past known events and another for making predictions about the future. In both cases, though, predictions are made recursively, by evaluating the forecast at
t+1, then using it to forecast t+2, and so on.
You must choose either one of these methods while loading your time series data, as this imposes some constraints on the restructuring of the time series for training.
Namely,
n testing records (the n last ones) are saved for
testing and sometimes a small number of records from the top must be
deleted. However, you can also change these parameters later in the Settings
Panel.
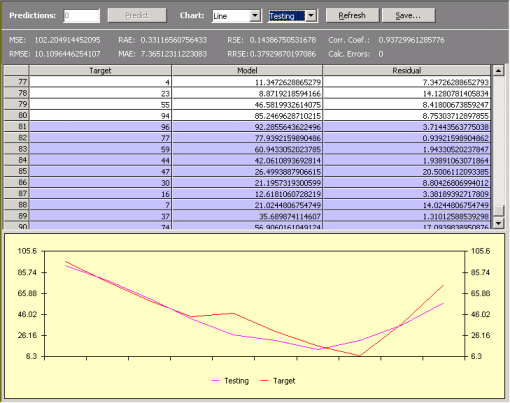
Thus, the first type of prediction can be used for research or pre-evaluation purposes, as it allows you to test the forecasting capabilities of your model on a set of test observations.
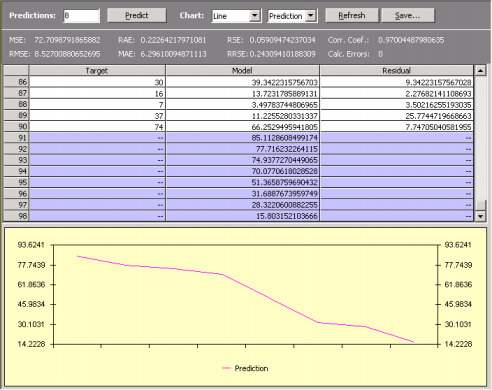
The second type is used obviously to predict unknown behavior, and APS 3.0 allows you to venture into the future as far as you see fit, by setting the number of predictions you want to make and then click the Predict button.
Furthermore, on the Predictions
Panel, you can analyze the performance of your model in the training set and compare its output with the actual values using both a spreadsheet and a chart.
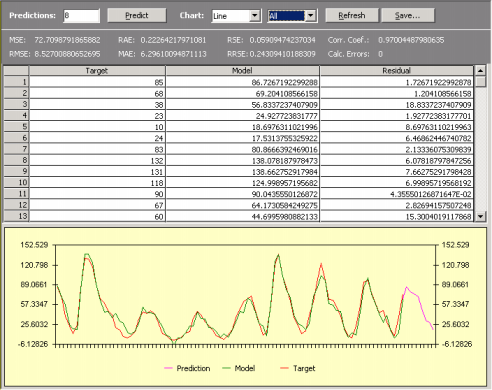
The charts of APS 3.0 come in various flavors, and you can choose Line, Area, 3D Line, and 3D Area for analyzing your model. You can also choose to plot only the output of your model, or the target values, or the predictions (either testing or real ones, depending on the option previously chosen).
The 3D charts can be moved around for a different perspective by pressing Ctrl and dragging it with the mouse.
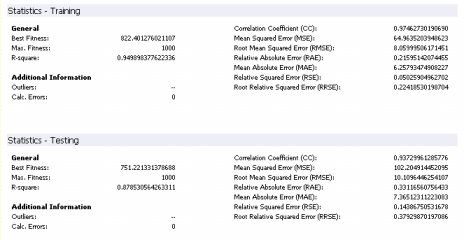
Additionally, APS 3.0 performs an extremely complete statistical analysis of your model both for the training set and the testing predictions, including mean squared error, root mean squared error, mean absolute error, relative squared error, root relative squared error, relative absolute error, correlation coefficient, and R-square.
The output of all these statistical functions is conveniently shown in the
Predictions
Panel for a quick evaluation during the modeling process and are also shown in the
Report Panel for future reference.
|