| The Training & Testing Results Windows
allow you to
visualize and evaluate the accuracy of your models and gives access to the following
settings and features:
Training Option
By selecting this option you have access to all the statistical evaluations
of your model on the training set. You also can compare the output of your model with the target output on the training set using either a
table or different charts.
Testing Option
By selecting this option you have access to all the statistical evaluations
of your model on the testing set. You also can compare the output of your model with the target output on the testing set using either a
table or different charts.
Best Fitness
Shows the fitness
of the active model on the current set.
R-square
Shows the R-square
of the active model on the current set.
Max. Fitness
Shows the value of maximum fitness on the
current set.
Confusion Matrix
This box is specific of Classification problems, and therefore only dashes are shown in Function Finding.
Grid Option
By selecting the Grid Option you can compare the output of your model with the target output on the
current set on a spreadsheet where the target and model output are
placed side by side.
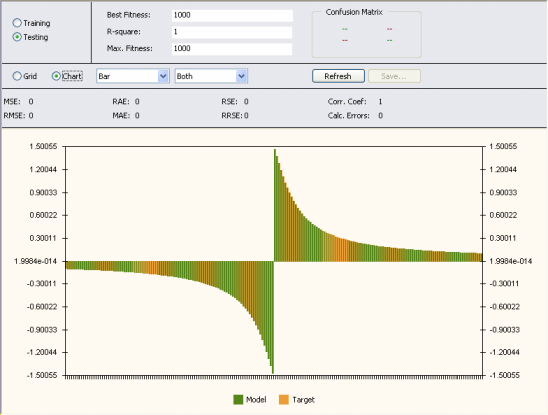
Chart Option
By selecting the Chart Option you can compare the output of your model with the target output on the
current set using different curve fitting charts. You choose the chart type with the aid of two boxes. In the first you select the chart type (Line, Area,
Bar, Step, 3D Line, 3D Area, 3D Bar, or 3D Step). And in the second you select the data you want to plot (Model, Target, or Both).
The plots show only a maximum of 250 points at a time and, therefore, for datasets
with more than 250 samples you must move the scroll bar at the
bottom of the chart to see all the results. Then, by placing the
cursor over the chart, GeneXproTools shows you the exact range used to draw the plot.
Refresh Button
Refreshes the panel. This button is particularly useful when you change your model in the
Change Seed window or change the
current
set or the fitness function.
Save Button
This button is only active when the Grid Option
is selected as it saves all the results in the table to a file.
MSE
Shows the value of the Mean Squared Error on the
current set.
RMSE
Shows the value of the Root Mean Squared Error on the
current set.
RAE
Shows the value of the Relative Absolute Error on the
current set.
MAE
Shows the value of the Mean Absolute Error on the
current set.
RSE
Shows the value of the Relative Squared Error on the
current set.
RRSE
Shows the value of the Root Relative Squared Error on the
current set.
Corr. Coef.
Shows the value of the Correlation Coefficient on the
current set. This parameter is not shown when the fitness function is
Relative With
SR, Relative/Hits,
Absolute With
SR, or Absolute/Hits.
In this case the number of outliers is shown instead.
Outliers
Shows the number of outliers in the current set. This parameter refers only to the fitness functions
Relative With
SR, Relative/Hits,
Absolute With
SR, and Absolute/Hits. The
rows with the outliers are easily identified by a yellow strip.
Calc. Errors
Shows the number of calculation errors in the current set. Note that, unless you’ve changed
either the training set or the model after a run, no calculation errors should appear in the training set as models returning calculation errors during training
have zero fitness and are, therefore, excluded. On the testing set,
though, calculation errors might occur and you can see straightaway
how many times in the Calculation Errors box. In addition, the rows with calculation errors are easily identified by a red strip and the identifier
ERROR. In the charts, you can also easily spot the points returning
calculation errors as they are not drawn, creating a discontinuity
in the plots.
|