| The History Panel lists all the
best-of-generation models created in a run and gives access to the following
settings and features:
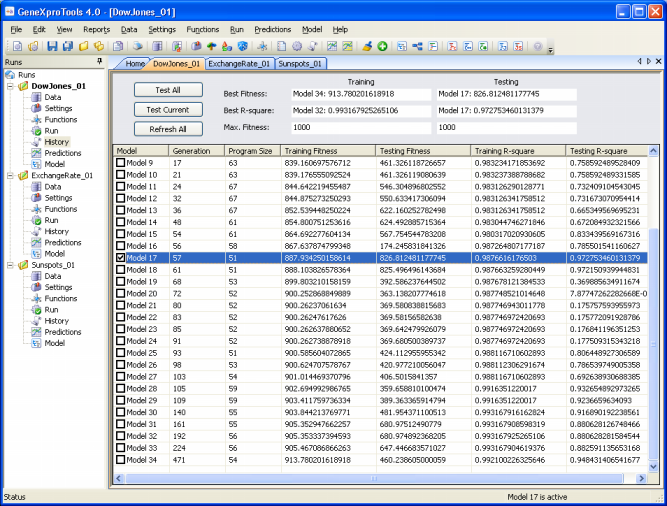
Test All Button
Evaluates the performance of all the models in the History Panel on the testing set, showing their respective
fitnesses and
R-squares. When in
Prediction Mode, then this button is
disabled.
Test Current
Button
Evaluates the performance of the selected model on the testing set, showing its
fitness and R-square.
When in Prediction Mode, then this button is
disabled.
Refresh All
Button
Evaluates the performance of all the models in the History Panel both on the training and testing sets, and updates all the
fitnesses and
R-squares. For
instance, this button is particularly useful when you have changed the fitness function after a run and
would want to evaluate the performance on the training set with this new fitness function.
Best of Run – Training
This heading is used to identify the best models of the run on the training set in terms of
fitness and R-square, showing also the exact values of their fitness and
R-square. For reference, the value of Max. Fitness on the training set is also shown.
Best of Run – Testing
This heading is used to identify the best models of the run on the testing set in terms of
fitness and R-square, showing also the exact values of their fitness and R-square. For reference, the value of Max. Fitness on the testing set is also shown.
When in Prediction Mode, a dash is shown in all the boxes under this heading.
Model Column
In this column are shown the names of all the best-of-generation
models created in the run. By clicking a model, you are making it your active model.
By clicking the column heading, GeneXproTools allows you to sort the
models in ascending or descending order.
Generation Column
In this column is shown the number of the generation in which the model was created.
By clicking the column heading, GeneXproTools allows you to sort the
models in ascending or descending order.
Program Size Column
In this column is shown the program size of all the
best-of-generation models. By clicking the column heading,
GeneXproTools allows you to sort the models in ascending or
descending order of their program sizes.
Training Fitness Column
In this column is shown the fitness
obtained by each model on the training set. By clicking the column
heading, GeneXproTools allows you to sort the models in ascending or
descending order of their training fitnesses.
Testing Fitness Column
In this column is shown the fitness
obtained by each model on the testing set. Note that, after a run, only the fitness of the
best-of-run model is shown; all the others are set to zero. In order to update these values, you must either click on the
Test All or Test Current buttons. When in Prediction Mode, though, a dash is shown in all the entries under this heading.
By clicking the column heading, GeneXproTools allows you to sort the
models in ascending or descending order of their testing fitnesses.
Training R-square Column
In this column is shown the R-square
obtained by each model on the training set. By clicking the column
heading, GeneXproTools allows you to sort the models in ascending or
descending order of their training R-squares.
Testing R-square Column
In this column is shown the R-square
obtained by each model on the testing set. Note that, after a run, only the R-square of the
best-of-run model is shown; all the others are set to zero. In order to update these values, you must either click on the
Test All or Test Current buttons. When in Prediction Mode, though, a dash is shown in all the entries under this heading.
By clicking the column heading, GeneXproTools allows you to sort the
models in ascending or descending order of their testing R-squares.
|