| GeneXproTools 4.0 implements the Correlation
Coefficient fitness function both with and
without parsimony pressure. The
version with parsimony
pressure puts a little pressure on the size of the evolving
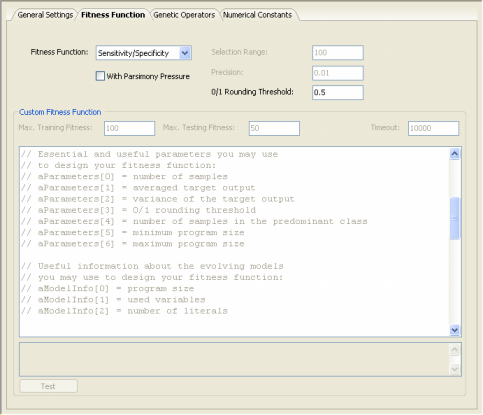
solutions, allowing the discovery of more compact models. For all classification problems, in order to be able to apply a particular fitness function, the learning algorithms of GeneXproTools 4.0 must convert the value returned by the evolved model into “1” or “0” using the 0/1 Rounding Threshold. If the value returned by the evolved model is equal to or greater than the rounding threshold, then the record is classified as “1”, “0” otherwise. Thus, the 0/1 Rounding Threshold is an integral part of all fitness functions used for classification and must be appropriately set in the Settings Panel -> Fitness Function Tab.
The Correlation Coefficient fitness function of GeneXproTools 4.0
is, as expected, based on the standard correlation
coefficient, which is a dimensionless index that ranges from -1 to 1 and reflects the extent of a linear relationship between
the predicted values and the target values.
where Cov(T,P) is the covariance of the target and model outputs; and st and sp are the corresponding standard deviations, which are given by:
where P(ij) is the value predicted by the individual program
i for sample case j (out of n fitness cases
or sample cases);
Tj is the target value for fitness case j; and
The correlation coefficient is confined to the range [-1, 1]. When
Ci = 1, there is a perfect positive linear correlation between
T and P, that is, they vary by the same amount. When Ci = -1, there is a perfect negative linear correlation between
T and P, that is, they vary in opposite ways (when T increases,
P decreases by the same amount). When Ci = 0, there is no correlation between
T and P. Intermediate values describe partial correlations and the closer to 1 or -1 the better the model. fi = 1000*Ci*Ci and therefore ranges from 0 to 1000, with 1000 corresponding to the ideal.
where Si is the size of the program, Smax and Smin represent, respectively, maximum and minimum program sizes and are evaluated by the formulas: Smax = G (h + t) Smin = G where G is the number of genes, and h and t are the head and tail sizes (note that, for simplicity, the linking function was not taken into account). Thus, when rfi = rfmax and Si = Smin (highly improbable, though, as this can only happen for very simple functions as this means that all the sub-ETs are composed of just one node), fppi = fppmax, with fppmax evaluated by the formula:
|