This indicator comes from the medical domain and consists of the percentage of people with a positive diagnostic test result who actually have the disease.
More formally, the positive predictive value PPVi of an individual program
i is evaluated by the equation:
where TPi, TNi, FPi, and
FNi represent, respectively, the number of true
positives, true negatives, false positives, and false
negatives.
TPi, TNi, FPi, and
FNi are the four different possible outcomes of a single prediction for a two-class case with classes “1” (“yes”) and “0” (“no”). A
false positive is when the outcome is incorrectly classified as “yes” (or “positive”), when it is in fact “no” (or “negative”). A
false negative is when the outcome is incorrectly classified as negative when it is in fact positive.
True positives and true negatives are obviously correct classifications.
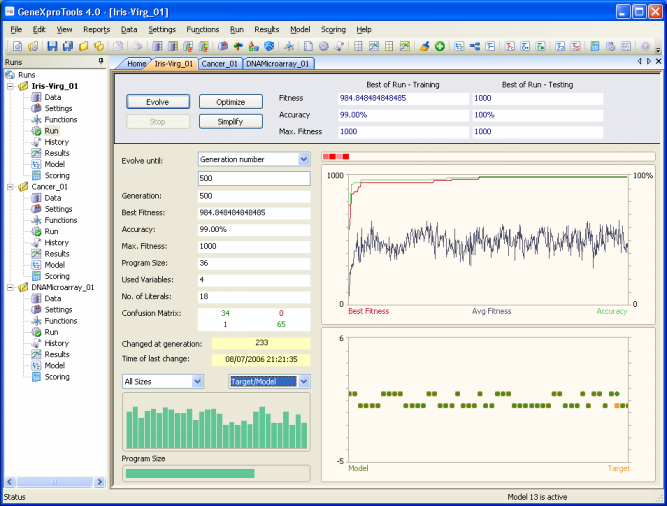
Keeping track of all these possible outcomes is such an error-prone
activity, that they are usually shown in what is called a
confusion matrix. And for all classification problems,
GeneXproTools 4.0 shows the confusion matrix for all the evolved
models and updates it continuously during the run.

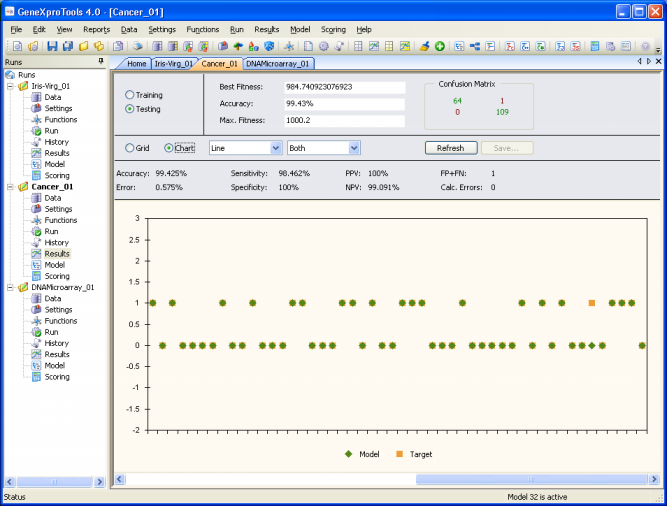
And to evaluate the PPV of your model both on the training
and testing data, you just have to go to the Results
Panel after a run.
|