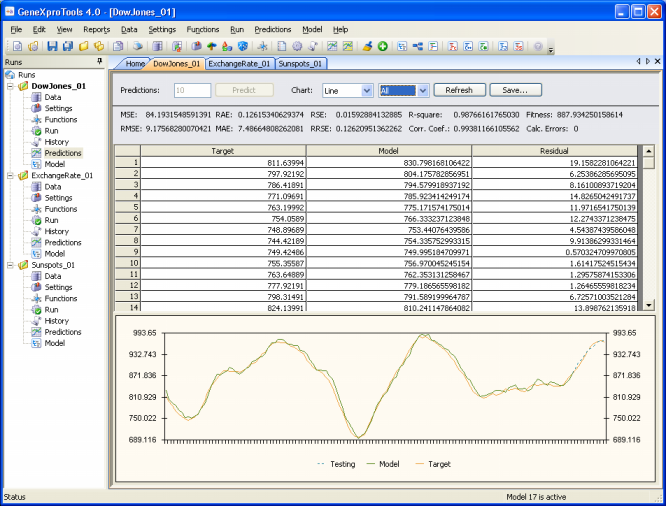
| The Predictions Panel allows you to
visualize and evaluate the accuracy of your models and gives access to the following
settings and features:
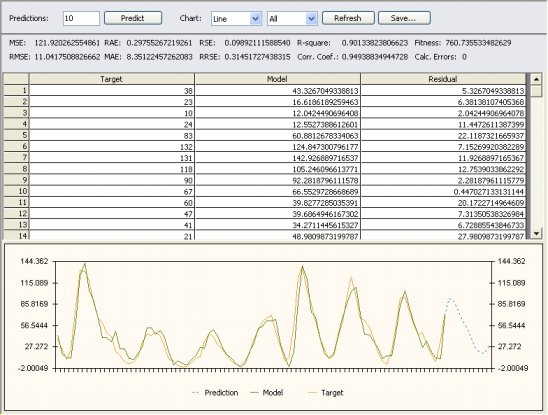
Predictions
The number of recursive predictions you want to make with the evolved model. The maximum number allowed is
9,999. When you are working on Testing Mode, this box is disabled.
Predict
Press this button to make the recursive predictions. The results are immediately written to the
table and chart of this panel. When you are working on Testing Mode, this button is
disabled.
Chart Type Box
In this combo box you select the chart type: Line, Area,
Bar, Step, 3D Line, 3D Area, 3D Bar, or 3D Step.
Chart Data Box
In this combo box you select the data you want to plot: Model, Target, Testing, or All if you are in Testing
Mode; or Model, Target, Prediction, or All if you are in Prediction Mode. In case of calculation errors, the sample with the error is skipped and a discontinuity is observed in the plot.
The plots show only a maximum of 250 points at a time and, therefore, for datasets
with more than 250 samples you must move the scroll bar at the
bottom of the chart to see all the results. Then, by placing the
cursor over the chart, GeneXproTools shows you the exact range used to draw the plot.
Refresh
Refreshes the panel. This button is particularly useful when you change your model in the
Change Seed window.
Save
Saves all the results in the table to a file.
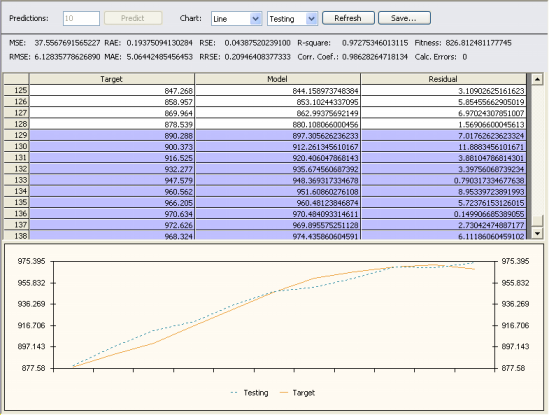
Statistics
By selecting Testing in the Chart Data box, you have access to a wide set of
statistical evaluations
of your model performed on the recursive testing. By selecting any of the other options in the Chart Data box (Model, Target, Prediction, or All), the statistics shown in the panel refer to the results obtained on the training set.
MSE
Shows the value of the Mean Squared Error on the
current set.
RMSE
Shows the value of the Root Mean Squared Error on the
current set.
RAE
Shows the value of the Relative Absolute Error on the
current set.
MAE
Shows the value of the Mean Absolute Error on the
current set.
RSE
Shows the value of the Relative Squared Error on the
current set.
RRSE
Shows the value of the Root Relative Squared Error on the
current set.
Corr. Coef.
Shows the value of the Correlation Coefficient on the
current set. This parameter is not shown when the fitness function is
Relative With
SR, Relative/Hits,
Absolute With
SR, or Absolute/Hits.
In this case the number of outliers is shown instead.
Outliers
Shows the number of outliers in the current set. This parameter refers only to the fitness functions
Relative With
SR, Relative/Hits,
Absolute With
SR, or Absolute/Hits. The
rows with the outliers are easily identified by a yellow strip.
Calc. Errors
Shows the number of calculation errors in the current set. Note that, unless you’ve changed
either the training set or the model after a run, no calculation errors should appear in the training set as models returning calculation errors during training
have zero fitness and are, therefore, excluded. However, on the
testing set or while making predictions, calculation errors might occur and you can see straightaway
how many times in the Calculation Errors box. In addition, the rows with calculation errors are easily identified by a red strip and the identifier
ERROR. In the charts, you can also easily spot the points returning
calculation errors as they are not drawn, creating a discontinuity
in the plots.
Table
The table allows you to compare the output of your model with the target output on the training set. If you are in Testing Mode, it also allows you to compare the results of your model on the recursive testing with the target output. The results obtained on the recursive testing are shown immediately after the results obtained on the training set and are highlighted in blue. And if you are in Prediction Mode, it shows you the recursive predictions made with your model. The recursive predictions are shown immediately after the results obtained on the training set and are
also highlighted in blue.
Target
Under this heading is shown the value of the dependent variable (Target) for all the records.
Model
Under this heading is shown the output of the model (Model) for all the records. In case of calculation errors, a red strip and the identifier ERROR is used.
Residual
Under this heading is shown the absolute value of the difference between the Target and the Model. This heading has another name (Relative Error) when the fitness function is
either Relative With
SR or Relative/Hits.
Relative Error
Under this heading is shown the absolute value of the difference between the Target and the Model. This heading has another name (Residual) when the fitness function is other than
Relative With
SR or Relative/Hits. In case of divisions by zero during the evaluation of the relative error,
a green strip and the identifier UNDEFINED is used.
Chart
The charts allow you to compare the output of your model with the target output on the training set using different
curve fitting charts. If you are in Testing Mode, they also allow you to compare the results of your model on the recursive testing with the target output. And if you are in Prediction Mode, they allow you to analyze the recursive predictions made with your model. In addition, you may choose to observe All the plots together, or you may choose to plot the Model, the Target, the Testing or the Prediction separately.
The plots show only a maximum of 250 points at a time and,
therefore, for more than 250 points you must move the scroll bar on
the right of the table and GeneXproTools will redraw the plot starting at the
first visible row. Then, by placing the
cursor over the chart, GeneXproTools shows you the exact range used to draw the plot.
All the plots can be copied to the clipboard by clicking in the plot
area and pressing the right button of the mouse.
|