| The Training Set Tab gives access to the following
settings and features:
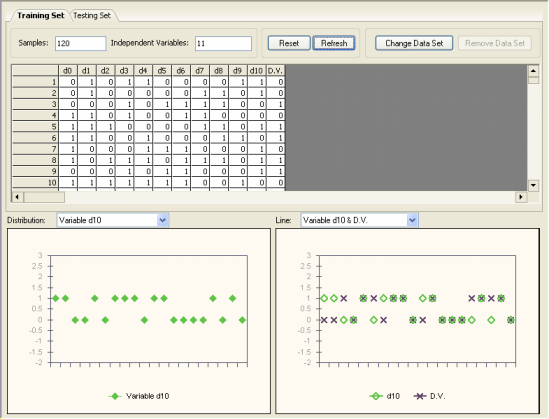
Samples
Allows you to select a subset of samples for training.
Independent Variables
This box is informative only and shows the number of independent variables in the training set.
Reset Button
Reverts to the total number of training samples in your data.
Refresh Button
Refreshes the panel after changing the training data set.
Change Data Set Button
Allows you to choose another training set for modeling. Note
that
GeneXproTools 4.0 not only allows you to change a training set by
another with the same structure, that is, the same number of
independent variables, but also allows you to replace the training
set by another
one with a different structure. Obviously, in this case, all the
models in the run history will be invalidated and the testing set,
if there is one, will be automatically removed.
Table
Shows all the variables in the training set. The entire table
can be copied to the clipboard by choosing Copy on the Edit Menu.
You can also copy selected columns to the clipboard with the mouse
right-click.
Distribution
Allows you to visualize the distribution of values for each variable in the training set.
This plot shows a maximum of 20 points at a time and, therefore,
for datasets with more than 20 samples you must move the scroll bar
on the right of the table and GeneXproTools will redraw the plot starting at
the first visible row. Then, by placing the cursor over the plot, GeneXproTools
shows you the range used to draw the plot. GeneXproTools allows
you to copy or print this plot through the mouse right-click.
Line
Plots each independent variable together with the dependent
variable or function output. This plot shows a maximum of 20 points at a time and, therefore,
for datasets with more than 20 samples you must move the scroll bar
on the right of the table and GeneXproTools will redraw the plot starting at
the first visible row. Then, by placing the cursor over the plot, GeneXproTools
shows you the range used to draw the plot. GeneXproTools allows you
to copy or print this plot through the mouse right-click.
|