| The Report Panel of GeneXproTools 4.0 keeps a summary of all the relevant information of a run,
and is organized into the following headings:
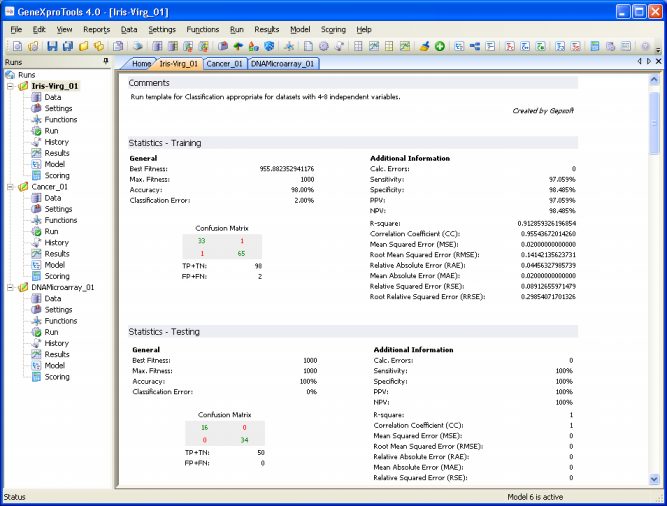
Comments
This heading is usually used to give a small description of the problem, the objectives, the kind of data used, their source, etc. Both the comments and the author's name are introduced by choosing Properties
on the
File Menu.
Statistics – Training
Under this heading are listed the values of all statistical functions used by
GeneXproTools 4.0 to evaluate the accuracy of your model on the training
set:
classification error,
classification accuracy,
confusion matrix (true positives, true negatives, false positives, and false negatives),
sensitivity, specificity,
positive predictive
value, negative predictive
value, mean squared error,
root mean squared error,
mean absolute error,
relative squared error,
root relative squared
error, relative absolute
error, correlation
coefficient, and R-square.
Also listed under this heading are more general run parameters such as best fitness, maximum fitness,
and number of calculation errors (they should always be zero, unless the
seed was modified or the training set was changed after the model had been
created).
A note of warning, though: All the parameters listed here refer to the last evaluated model in the
Results Panel, so make sure that they do refer to the model you are interested in (usually the active model, highlighted in yellow in the History heading).
Statistics – Testing
Under this heading are listed the values of all statistical functions used by
GeneXproTools 4.0 to evaluate the accuracy of your model on the testing set, that is, the efficiency of your model at predicting unknown
behavior: classification error,
classification accuracy,
confusion matrix (true positives, true negatives, false positives, and false negatives),
sensitivity, specificity,
positive predictive
value, negative predictive
value, mean squared error,
root mean squared error,
mean absolute error,
relative squared error,
root relative squared
error, relative absolute
error, correlation
coefficient, and R-square.
Also listed under this heading are more general run parameters such as best fitness, maximum fitness,
and number of calculation errors.
Note again that all the parameters listed here refer to the last evaluated model in the
Results Panel, so make sure that they do refer to the model you are interested in (usually the active model, highlighted in yellow in the History heading).
Data
Under this heading are listed the number of samples in the training set actually used during training (remember that
GeneXproTools 4.0 allows you to choose a smaller sub-set of the training set to use
during training), the number of testing samples used to test the generalizing capabilities of your model (again, not all the samples on the testing set were necessarily used to test your model), and the number of
attributes or independent variables in your data.
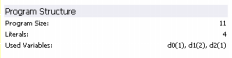
Program Structure
The program size, the number of literals, and a detailed list of
all used variables and respective weights are shown here. This
information refers to the active model highlighted in yellow in the
History heading.
Function Set
Under this heading are listed all the functions used to create your model, together with the symbols
used to represent them in Karva notation, their weights and
arities.
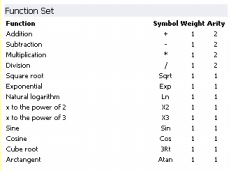
Note that the highest value of arity in your function set determines the structure of each gene, making the length of the
tail t grow according to the equation:
t = h (n-1) + 1
where h is the length of the head and
n is maximum arity.
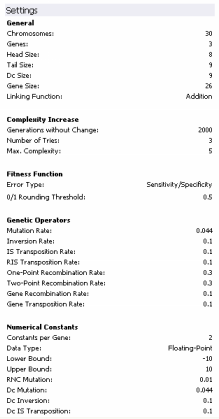
Settings
Under this heading there are five entries: General Settings,
Complexity Increase, Fitness Function, Genetic
Operators, and Numerical Constants. Under General Settings are listed the number of chromosomes, number of genes, head size,
tail size, Dc size, gene size, and linking function. Under
Complexity Increase are listed the number of Generations Without
Change, the Number of Tries, and Max. Complexity. The name of the fitness function and
the 0/1 rounding threshold are given below
the entry Fitness Function.
Under Genetic Operators are listed the rates of all the genetic operators used to create genetic variation. And, finally,
all the parameters relevant to the manipulation of random numerical
constants are listed under Numerical Constants.
Data Sources
Under this heading the paths to the input files (training and testing files) used to create your model are given so that their origin could be easily identified.
File Path
Under this heading the path to the gep file that was used to save your model is given so that it can be easily traced for future reference.
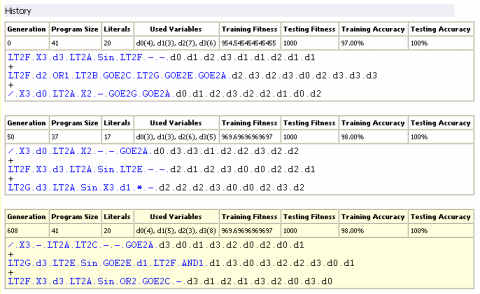
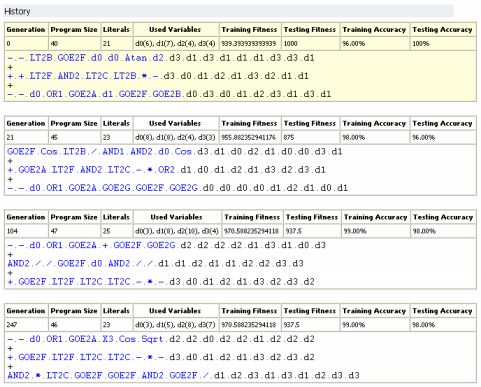
History
Under this heading are listed all the best-of-generation models, including obviously the best-of-run model, discovered during the evolutionary process. Note, however, that the notation "best-of-run" and "best-of-generation" refers to the performance of these models on the training set, which could be slightly different on the testing set. This is why
GeneXproTools 4.0 allows you to analyze the performance of all these models on the testing set and, if appropriate, choose the best model based on these results.
GeneXproTools 4.0 gives you the possibility of highlighting in yellow one of these models (the active model) and we advise you to use this feature to highlight the best one. Note also that, for a quick reference,
not only the program structure (program size, number of literals,
and list of used variables and respective weights) but also the fitness and the
accuracy of all these models both on the training and testing sets are also
given, although, for the testing set, they must be evaluated in the History
Panel.
For brevity sake, all the best-of-generation models are represented in the compact Karva notation, but you can translate any one of them into a more canonical representation by activating any
of these models in the History
Panel and then translate it into the language of your choice in the
Model Panel.
|