| The Run Panel allows you to control and
monitor the modeling process and gives access to the following settings
and features:
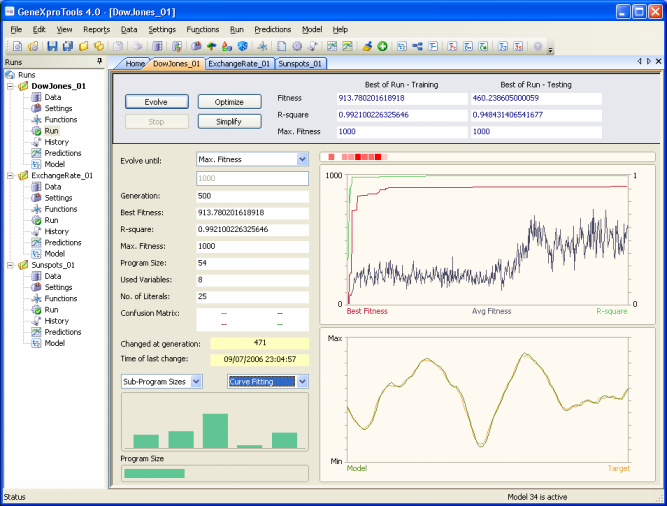
Evolve Button
Starts the evolutionary process from scratch, that is, from a completely random initial population.
Stop Button
Stops the evolutionary process.
Optimize Button
Starts the evolutionary process with a seed
model, using it to breed better models.
Simplify Button
Also starts an evolutionary process with a seed
model, but applies parsimony
pressure to design more compact solutions.
Best of Run – Training
Under this heading are shown the values of Fitness,
R-square, and Max. Fitness obtained on the training set for the best model of each run. These values are only updated at the end of each run or between
Complexity Increase cycles. They are also updated if some relevant setting is changed, say, a different fitness function, a different training set, or a different
model introduced through the Change Seed window, and if the model is afterwards processed in the
Predictions Panel.
Best of Run – Testing
Under this heading are shown the values of Fitness,
R-square, and Max. Fitness obtained on the testing set for the best model of each run. These values are only updated at the end of each run or between
Complexity Increase cycles. They are also updated if some relevant setting is changed, say, a different fitness function, or a different
model introduced through the Change Seed window, and if the model is afterwards processed in the
Predictions Panel. When in Prediction Mode, a dash is shown in all the boxes.
Evolve Until
Sets the stop condition. This stop condition is formulated using two different boxes. In the first you choose the stop condition and, in the second, you set the value for the chosen condition. There are four different stop conditions to choose from. The first allows you to evolve models for a certain number of
generations. In this case, you must write in the box underneath the number of generations you want. The second allows you to evolve models until the best fitness is equal to or higher than a certain value. In this case, you must write in the box underneath this fitness value. The third allows you to evolve models until the
R-square of the best model is equal to or higher than a certain value. In this case, you must write in the box underneath this R-square value. Obviously, only values higher than 0 and equal to or less than 1 are valid, and if an invalid value is used
GeneXproTools uses the value of 1 by default. The fourth allows you to evolve models until the best fitness is equal to maximum fitness. In this case, the correct value of maximum fitness is automatically introduced by
GeneXproTools in the box underneath.
Generation
Updates the generation number throughout a run.
Best Fitness
Updates the best fitness of each generation throughout a run.
R-square
Updates the R-square
of the best-of-generation model throughout a run.
Max. Fitness
Shows the value of maximum fitness for the current run.
Program Size
Updates the program size of the best-of-generation model throughout a run.
Used Variables
Updates the number of variables used in the best-of-generation
model throughout a run.
No. of Literals
Updates the number of literals used in the best-of-generation
model throughout a run.
Confusion Matrix
This box is specific of Classification problems, and therefore only dashes are shown in
Time Series Prediction.
Changed at Generation
Updates, throughout a run, the number of the generation at which a change in best fitness occurred.
Time of Last Change
Updates, throughout a run, the time when a change in best fitness occurred.
Charts List Boxes
The one on the left allows you to select three different bar
plots: Sub-Program Sizes, All Sizes, and All Fitnesses. And the one
on the right allows you to select two different charts: Curve
Fitting and Avg/Best Size.
Sub-Program Sizes Chart
This chart shows
the sizes of all the sub-programs in the best-of-generation model.
Not only after a run but also during evolution, by placing the
cursor over each bar you can access the size of all sub-programs
in your model. The Sub-Program Sizes chart can be visualized any
time during evolution by selecting Sub-Program Sizes in the
leftmost Chart List Box. GeneXproTools allows you to copy or
print this chart through the mouse right-click.
All Sizes Chart
This chart shows
the sizes of all the models in the population. Not only after a run
but also during evolution, by placing the cursor over each bar
you can access the size of a particular model; the
best-of-generation model always occupies the first position so
you can also easily see how it fares relatively to the others.
The All Sizes chart can be visualized any time during evolution
by selecting All Sizes in the leftmost Chart List Box.
GeneXproTools allows you to copy or print this chart through the
mouse right-click.
All Fitnesses Chart
This chart shows
the fitnesses of all the models in the population. Not only after a
run but also during evolution, by placing the cursor over each
bar you can access the fitness of a particular model; the
best-of-generation model always occupies the first position so
you can also easily see how it fares relatively to the others.
The All Fitnesses chart can be visualized any time during
evolution by selecting All Fitnesses in the leftmost Chart List
Box. GeneXproTools allows you to copy or print this chart through
the mouse right-click.
Program Size Chart
This chart shows
the size of the best-of-generation model. Not only after a run but
also during evolution, by placing the cursor over the horizontal
bar you can access the size of the best model. GeneXproTools
allows you to copy or print this chart through the mouse
right-click.
Curve Fitting Chart
This chart plots the first 250 data points of the training set
and shows how well the evolving models are fitting the target.
The Curve Fitting chart can be visualized any time during
evolution by selecting Curve Fitting in the rightmost Chart List
Box. GeneXproTools allows you to copy or print this chart through
the mouse right-click. And by placing the cursor over the line, you
can access the value of that point. You can also access the values
corresponding to the Max and Min labels that sometimes appear on the
Y axis by placing the cursor over them.
Avg/Best Size Chart
This chart plots together the average program size of the population
and the program size of the best-of-generation model.
This chart is especially useful during simplification
and can be visualized any time during evolution by selecting Avg/Best
Size in the rightmost Chart List Box. GeneXproTools allows you
to copy or print this chart through the mouse right-click. You can
also access the values corresponding to the Max and Min labels that
sometimes appear on the Y axis by placing the cursor over them.
Variables Usage Map
This map shows not only the variables that are being used by the
best-of-generation models but also their weight. Not only after
a run but also during evolution, by placing the cursor over each
square gives you access to the variable ID and the number of times it
appears in the current model. And by clicking the right button
of your mouse, you can also change its appearance: Heat Map,
Random Colors, or Monochromatic. And as usual, GeneXproTools allows you to
copy or print this chart through the mouse right-click.
Evolutionary Dynamics Chart
This chart shows
the average fitness of the population plus the fitness
and R-square of the best-of-generation model. The Y axis on the left refers to best and average fitness, whereas the Y axis on the right refers to the
R-square. The X axis corresponds obviously to the number of generations, with a complete screen spanning a total of 500 generations.
For a good adaptation, the plot for average fitness should never come near the plot for best fitness, otherwise the system is losing genetic diversity and becoming too uniform for an efficient evolution. Whenever this is happening in your system, you should obviously increase the
genetic diversity of the evolving populations by choosing the right set of genetic operators and adjusting their rates.
GeneXproTools allows you to copy or print this chart through the
mouse right-click.
|