|
The first step in using GeneXproTools is launching it and opening existing files or creating new ones.
To Start GeneXproTools 5.0
- In Windows, click Start, point to Programs, and point to the Gepsoft
GeneXproTools 5.0 folder.
The icons in the Gepsoft GeneXproTools 5.0 folder appear in a list.
- Click the GeneXproTools 5.0 program icon.
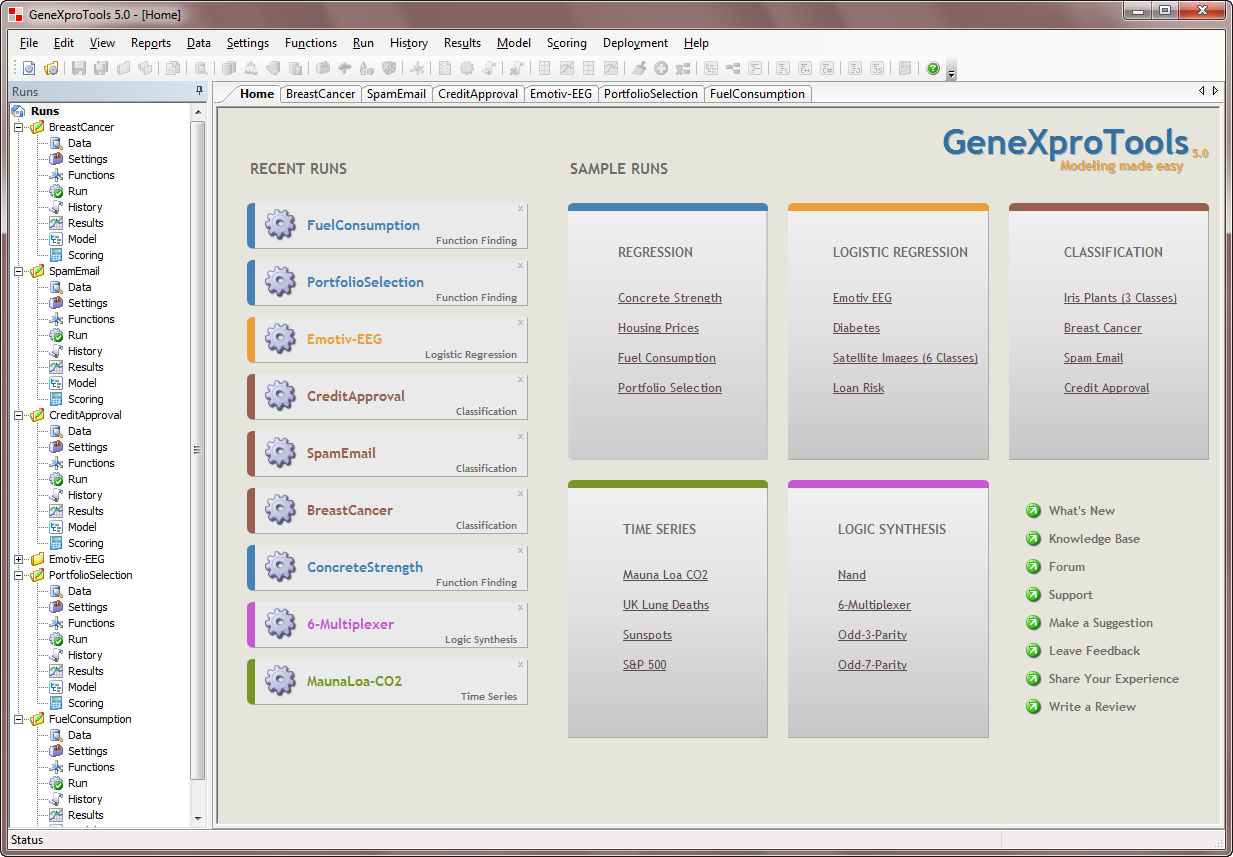
The Home Panel appears. This panel presents you with several choices, including start a new run or open an existing run.
- To start a new run, click the File menu and then choose New.
The New Run Wizard appears. This wizard helps you gather the necessary information to start evolving a model.
- To open an existing run, in the Home Panel either
choose a recent or sample run or click the File menu and then choose Open.
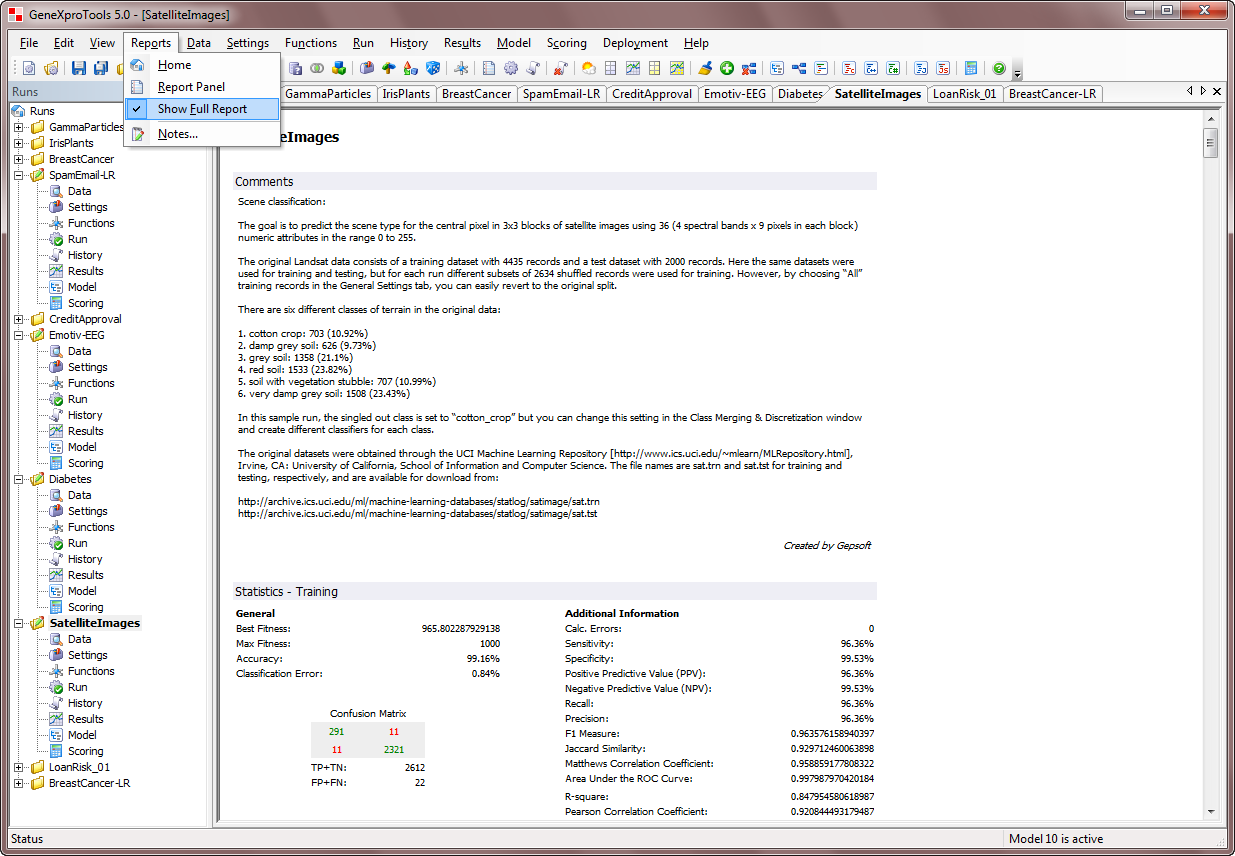
In the Report Panel you will find relevant information concerning this run, including all the settings used in the run, the statistical evaluation of the best-of-run
or active model, and a detailed account of all the
models in the run History.
The GeneXproTools 5.0 modeling environment contains 10 basic panels:
 |
Report Panel |
In the Report Panel you can find relevant information concerning
the run, including all the settings used in the run, the statistical evaluation of the best-of-run or active
model (highlighted in yellow in the History heading), and a detailed account of the evolutionary history of the run.
|
Data Panel |
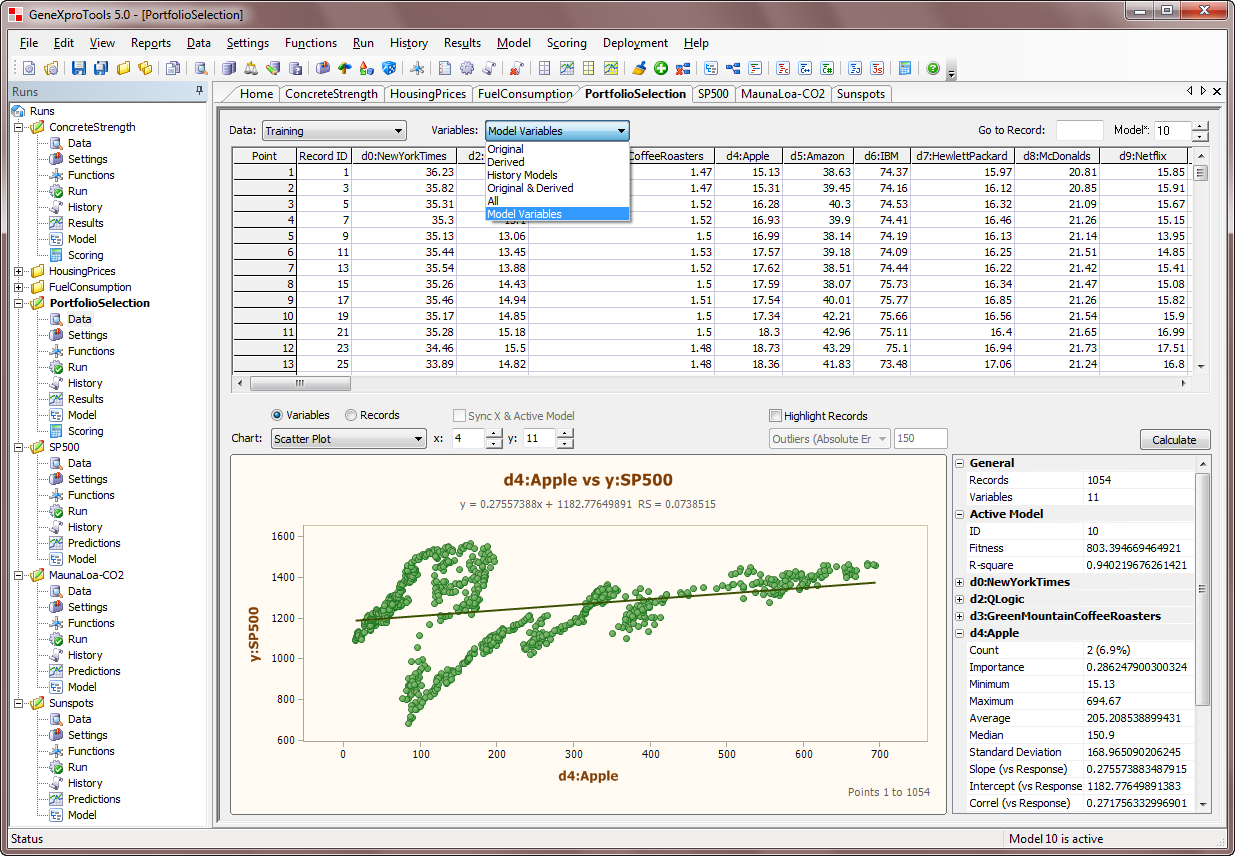
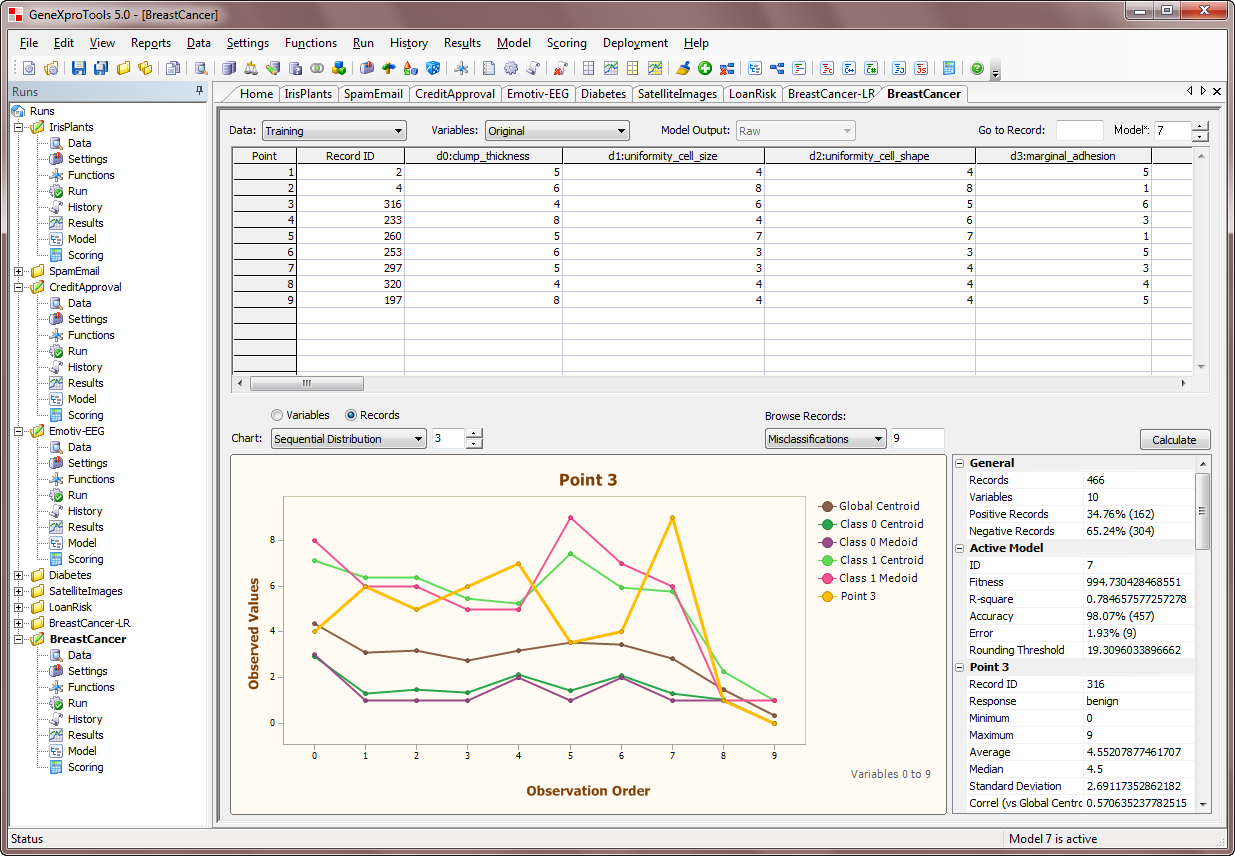
The multifunctional Data Panel goes beyond a simple platform
for analyzing and visualizing input data. Besides
allowing the analysis and visualization of input variables, it also
allows the visualization and analysis of all your models and
derived variables,
giving you access to a rich web of analyses between all these types of variables and
across different datasets.
The analyses you can do in the Data Panel include scatter plots and
regression analysis
between all possible pairs of variables (input variables, models and derived variables);
histograms and summary statistics for all variables and across different datasets;
different line charts for outlier detection and model analysis;
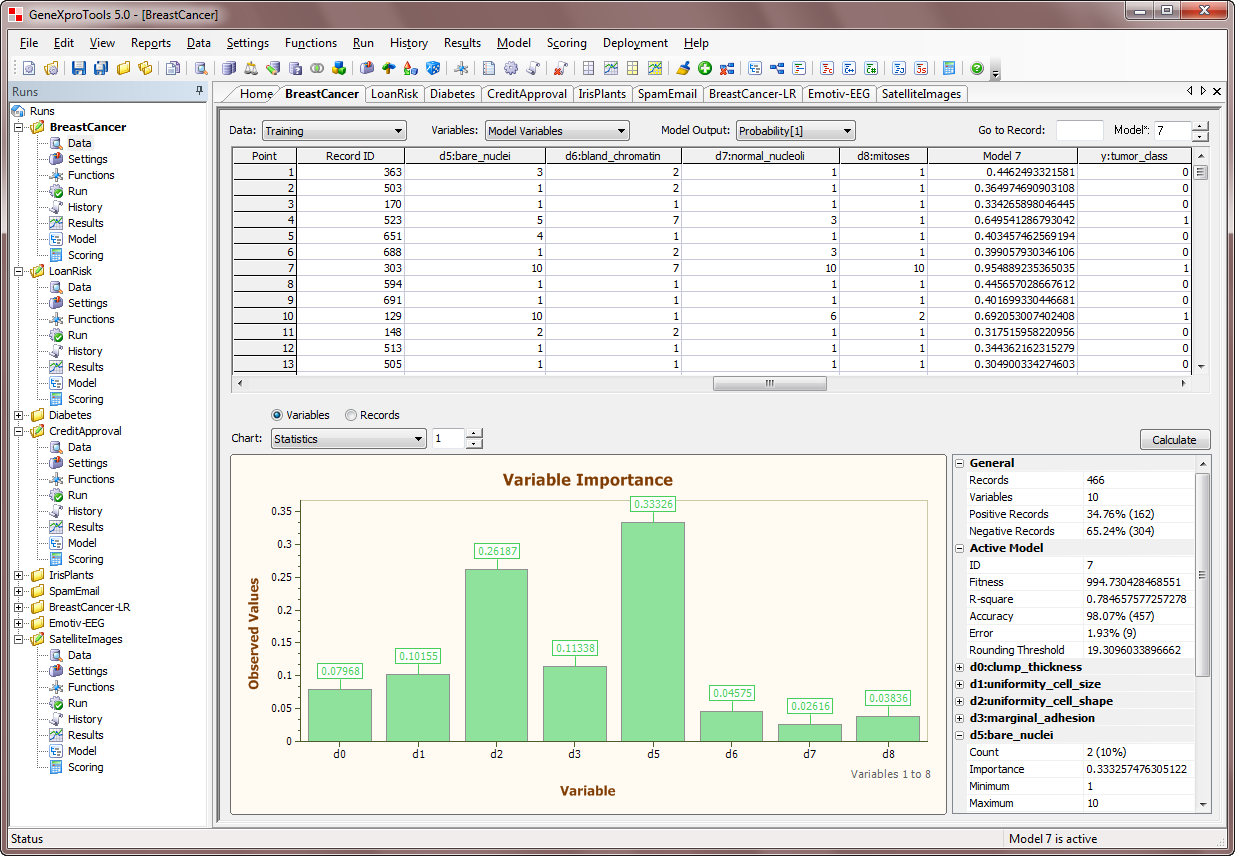
and evaluation of the variable importance and
display of the
variable importance chart for all the models.
The multifunctional Data Panel also supports extensive record analyses, allowing you to study
different types of records using different charts and browsing tools. For example,
you can compare each record with different record prototypes in order to gain insight
into both your data and your models.
By selecting just the outliers or the
misclassified records to browse, you can also perform
error analysis in the Data Panel.
|
Settings Panel |
The Settings Panel gives you
access to the most important settings of GeneXproTools, which are
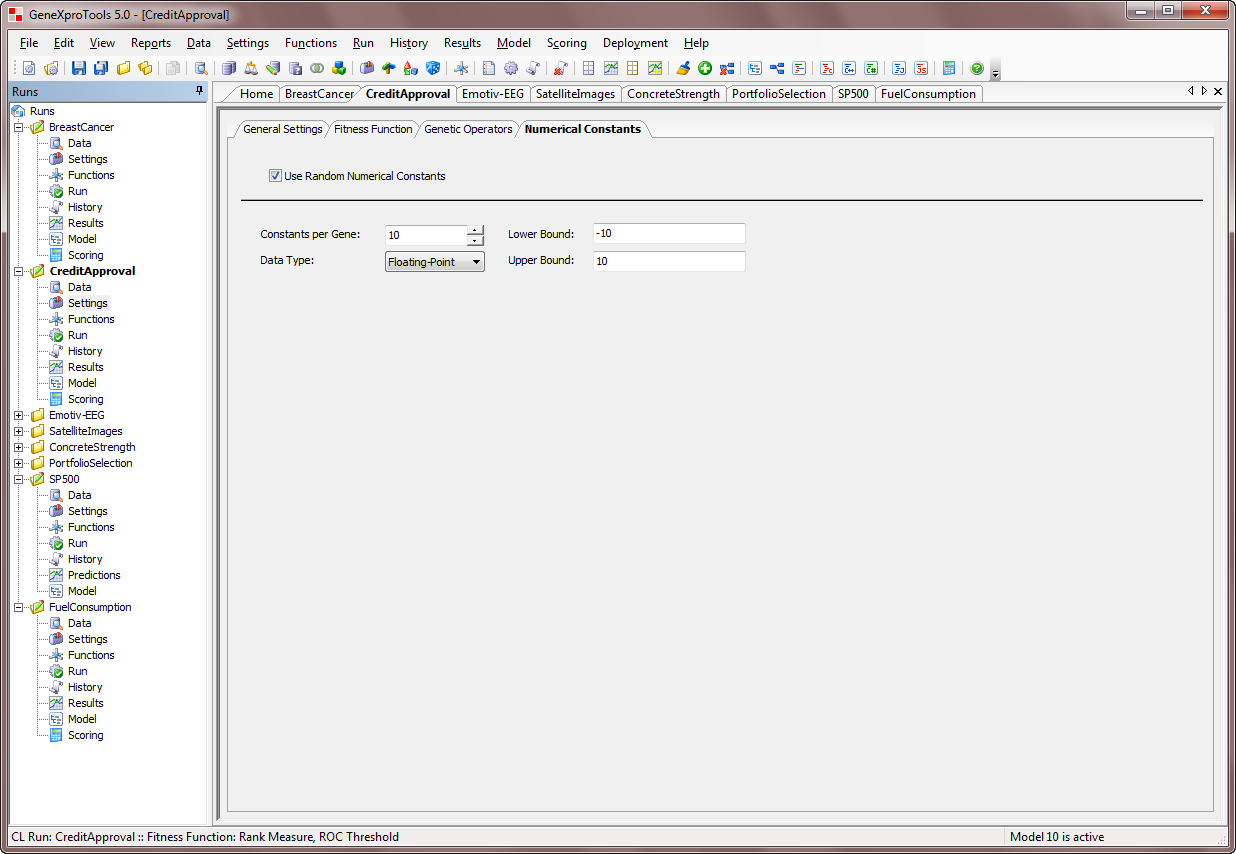
organized into four different tabs: General Settings, Fitness Function, Genetic Operators, and Numerical Constants.
General Settings Tab
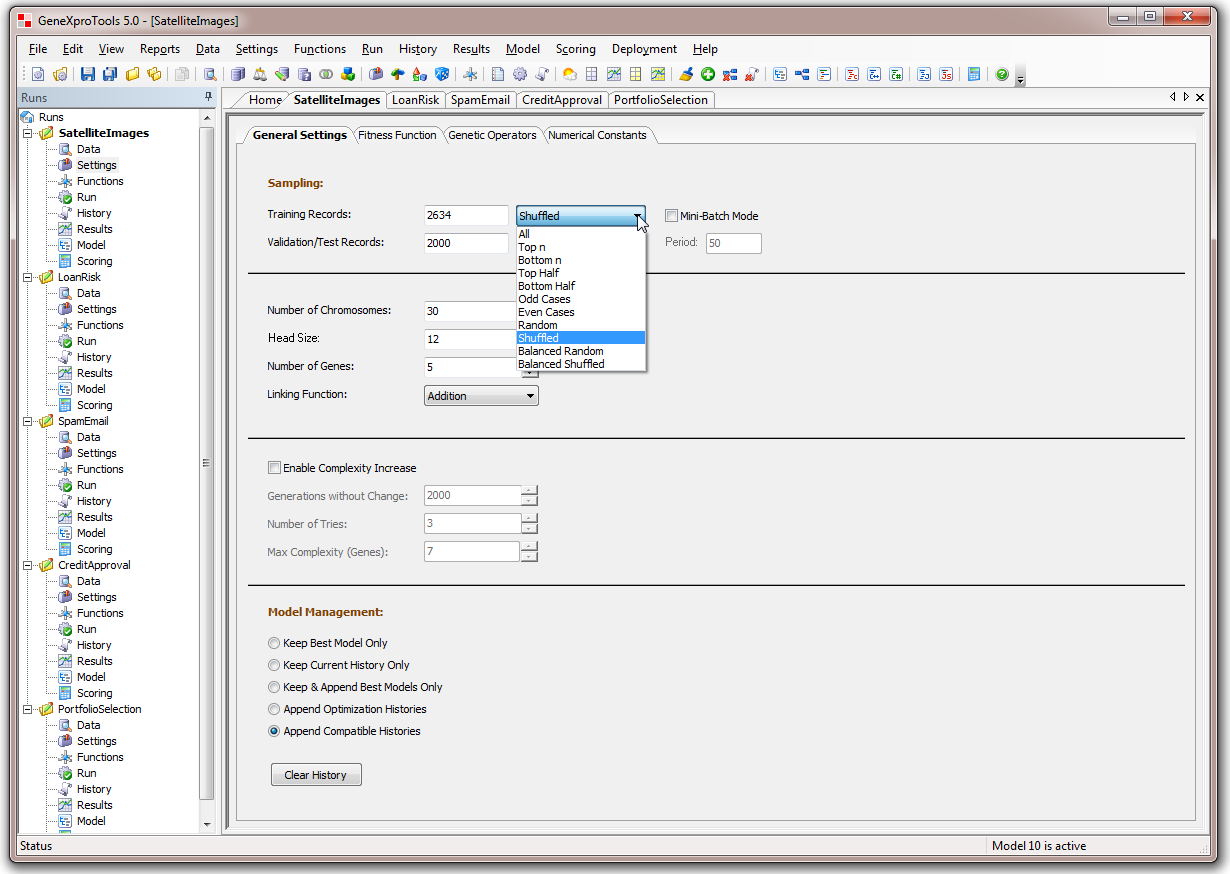
In the General Settings Tab you can change the number of
training and validation/test records, choose different
sub-sampling schemes for the training and validation/test
datasets, change the chromosome architecture, the linking function, the
number of chromosomes. Moreover, you can also choose the parameters for the Complexity Increase Engine
of GeneXproTools and choose different modes of Model Management.
Fitness Function Tab
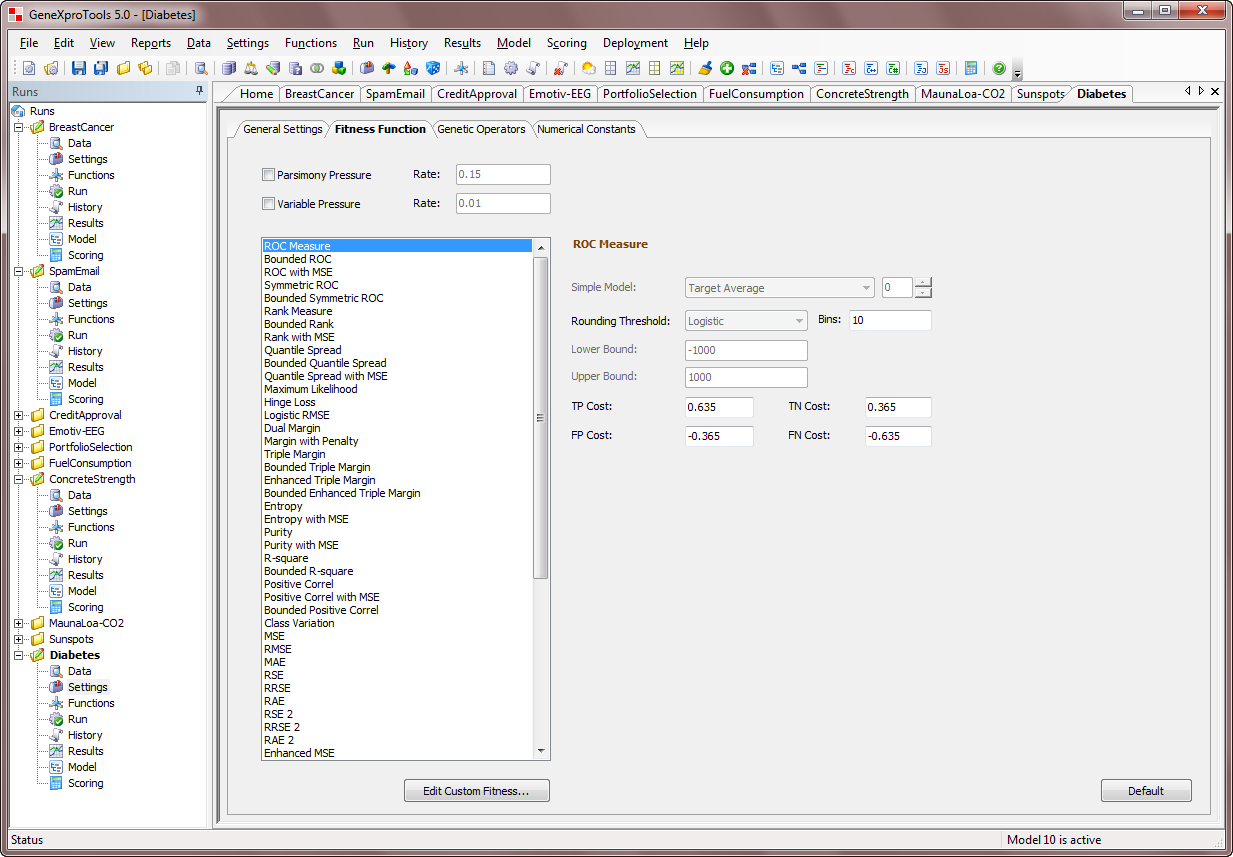
In the Fitness Function Tab you can choose one of the 100+ GeneXproTools
built-in fitness functions or design and test a fitness function of your own.
Genetic Operators Tab
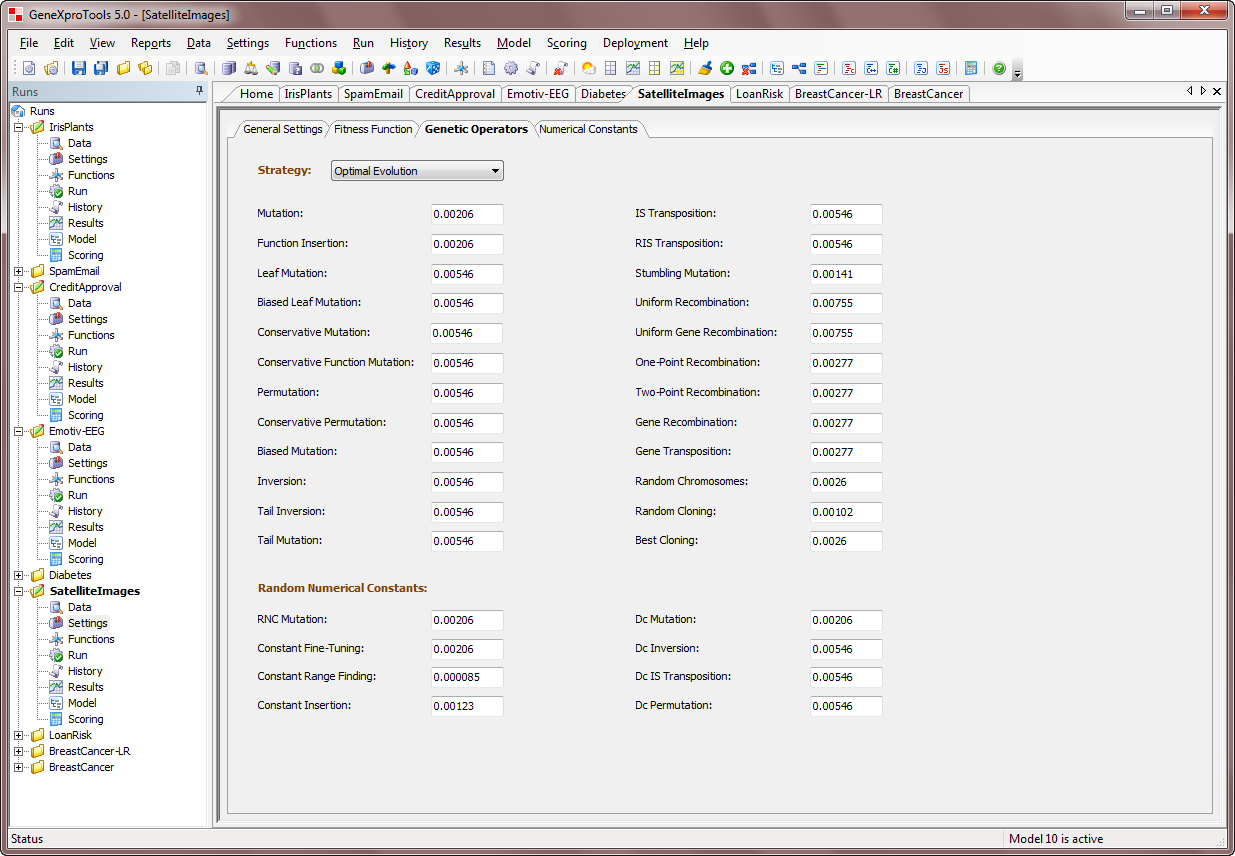
In the Genetic Operators Tab you can change the degree of genetic modification you want to use during evolution by choosing the kind of genetic operators and their corresponding rates.
Moreover, GeneXproTools provides 4 built-in modeling strategies
that cover some of the most common modeling needs, namely a strategy for
fine-tuning the numerical constants of your models (Constant Fine-Tuning); a strategy for
model fine-tuning where the overall structure of the model remains
basically unchanged making only small changes in the model’s structure (Model Fine-Tuning);
a strategy for Sub-set Selection which is ideal for creating good random forests,
especially for datasets with many variables, as it works only with the elements
that were randomly drawn for the initial population; and of course a
strategy designed for Optimal Evolution which tries to give a good blend
of diversity versus stability in order to optimize and accelerate evolution.
Numerical Constants Tab
In the Numerical Constants Tab you can activate the algorithm that enables the use of random numerical constants and customize both the type and range of
your constants, and the number of constants per gene.
|
Functions Panel |
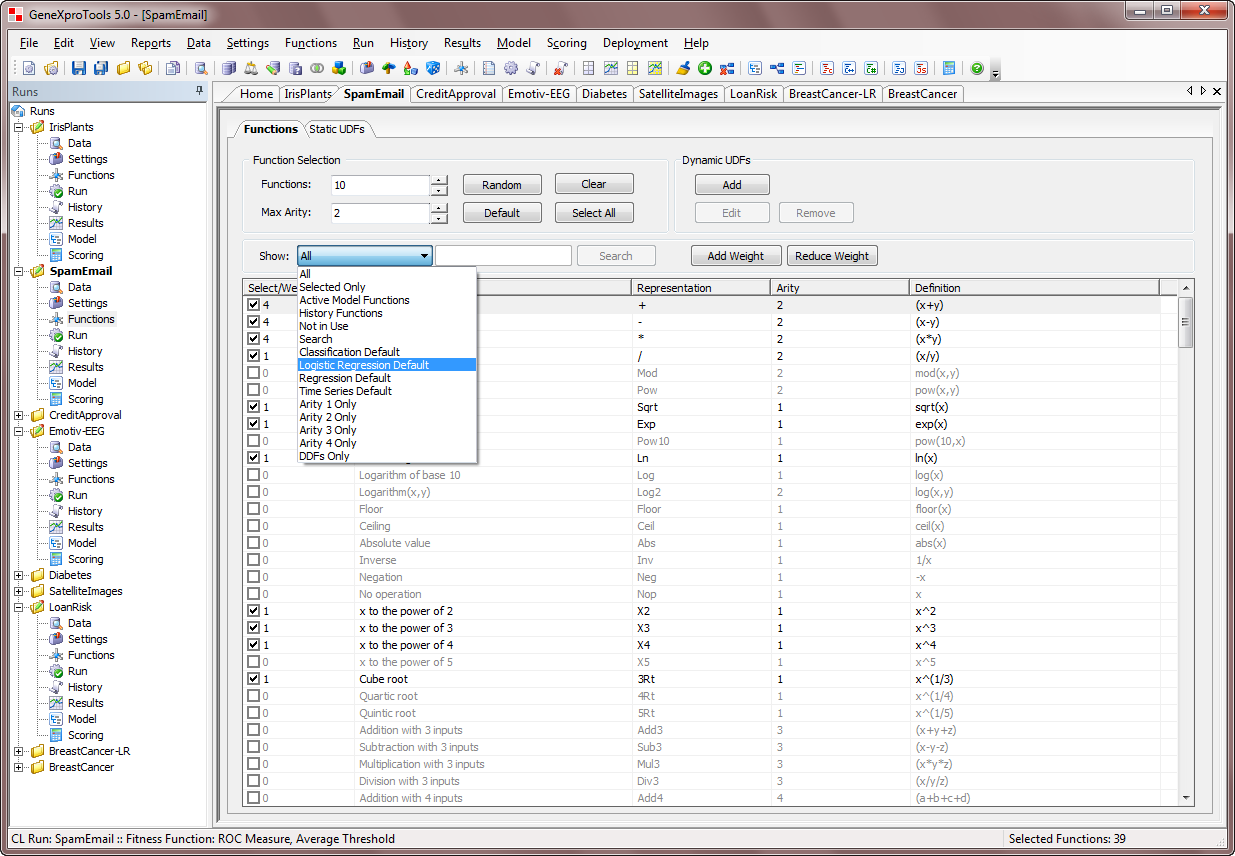
In the Functions Panel you choose the functions GeneXproTools will use to model your data.
For mathematical problems, there are a total of 279 built-in functions and
comparison rules, whereas for Boolean problems there are a total of
258 built-in logical functions.
|
Run Panel |
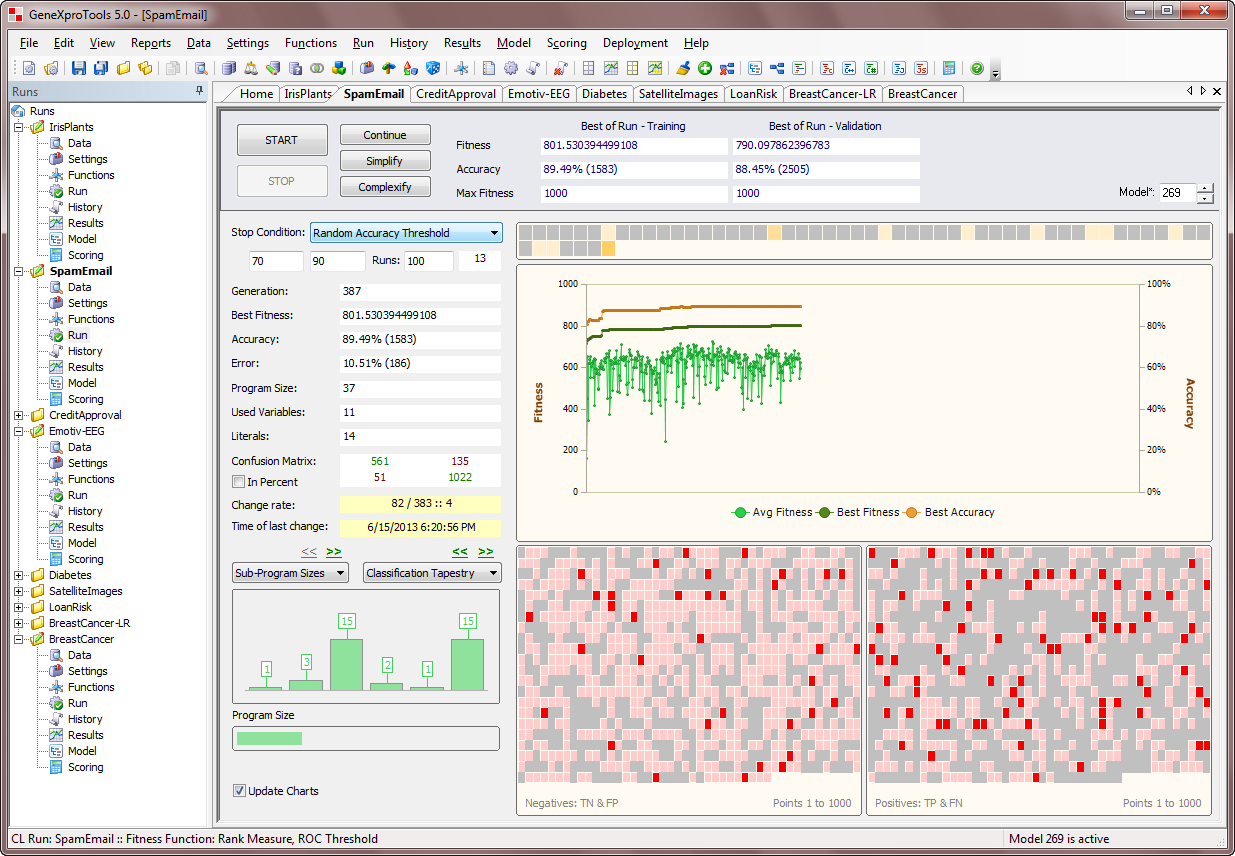
From the Run Panel you command
and visualize the creation, optimization, and simplification of your
models through the use of different model fitting charts, including
different kinds of curve fitting charts, scatter plots, and residual charts.
For Classification and Logistic Regression the model visualization tools include
different binomial fitting charts, the classification scatter plot and
the classification tapestry.
|
History Panel |
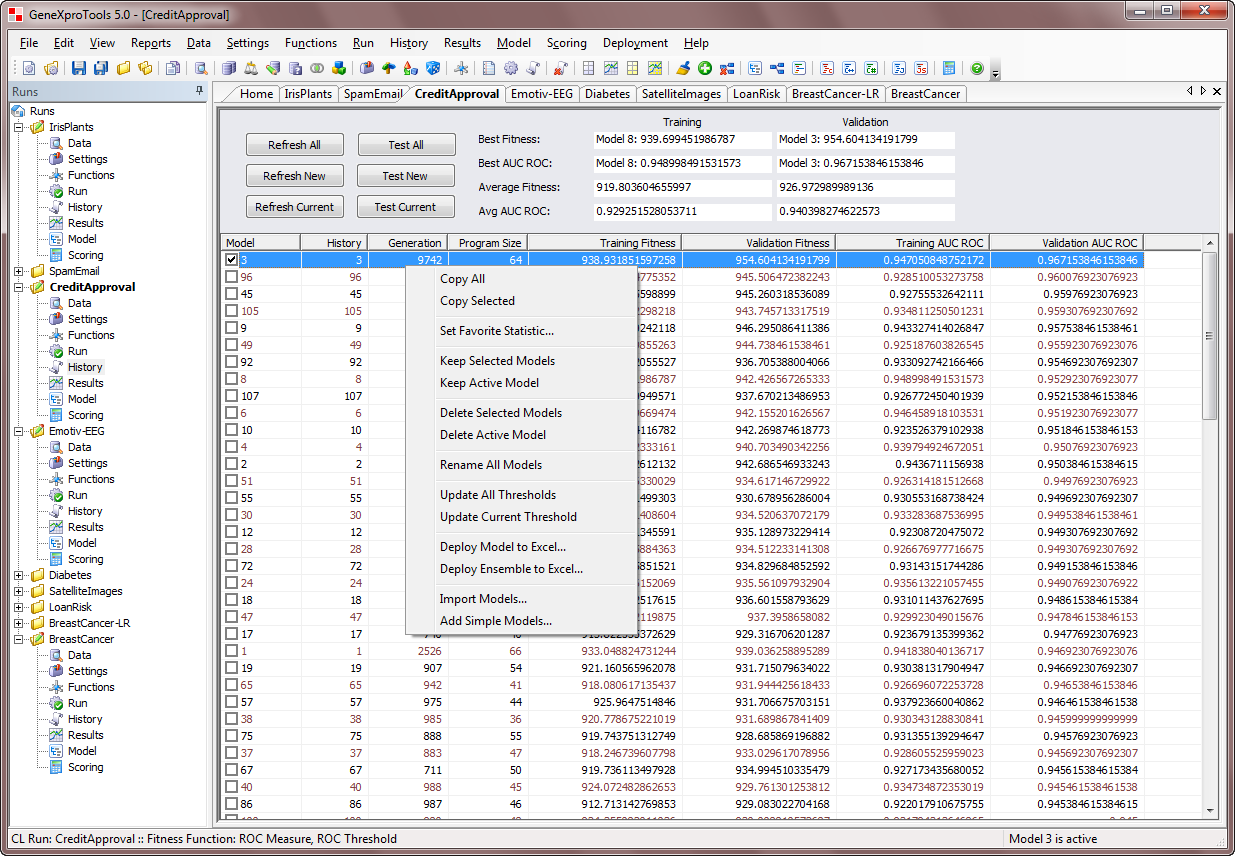
The History Panel allows you to manage your models by selecting and re-ordering them
using different Favorite Statistics. Moreover, you can also delete and import models
from different runs and deploy models or model ensembles to Excel.
|
Results Panel |
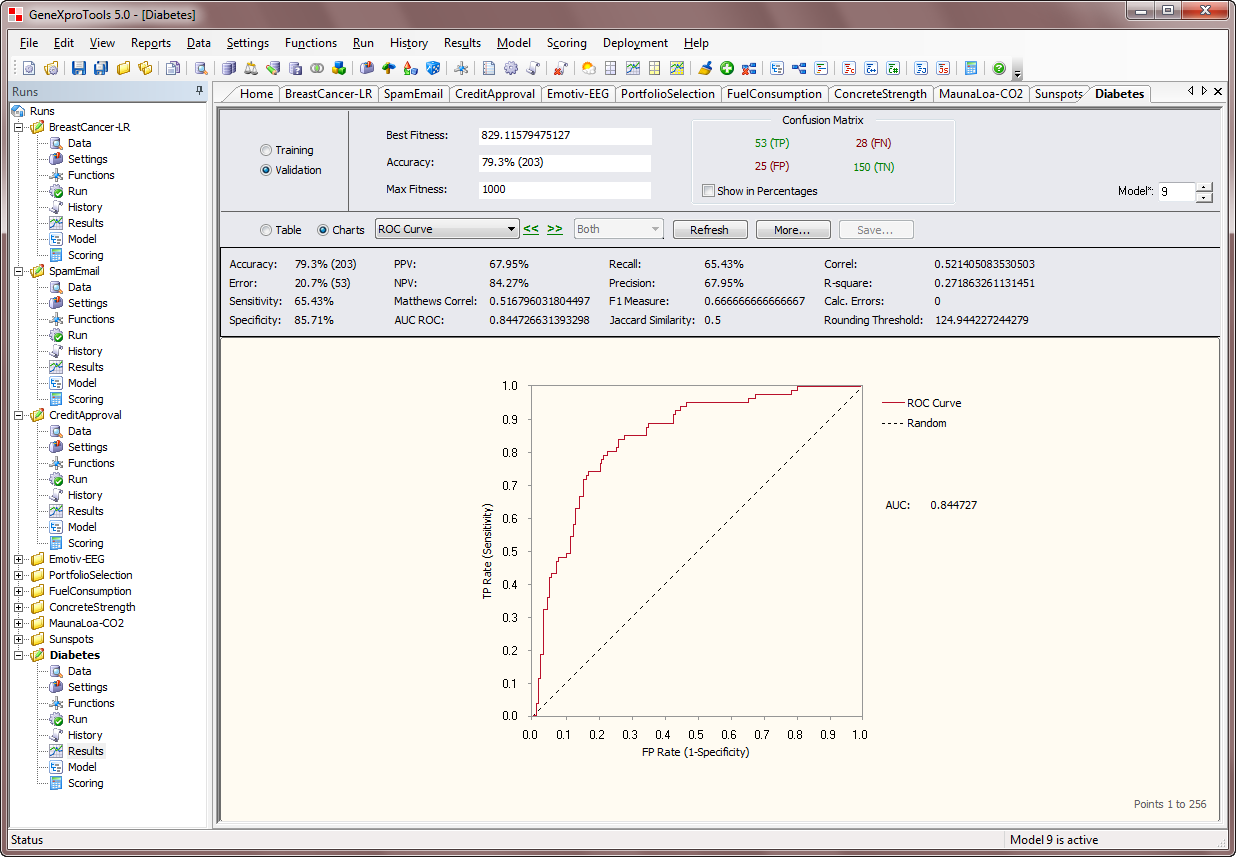
In the Results Panel a thorough
statistical analysis of the evolved model is done on the fly both
for the training and validation/test datasets. Furthermore, the model output and
the target are compared using both a table and several charts. The
number and type of available charts varies with the modeling category of the run.
|
Predictions Panel |
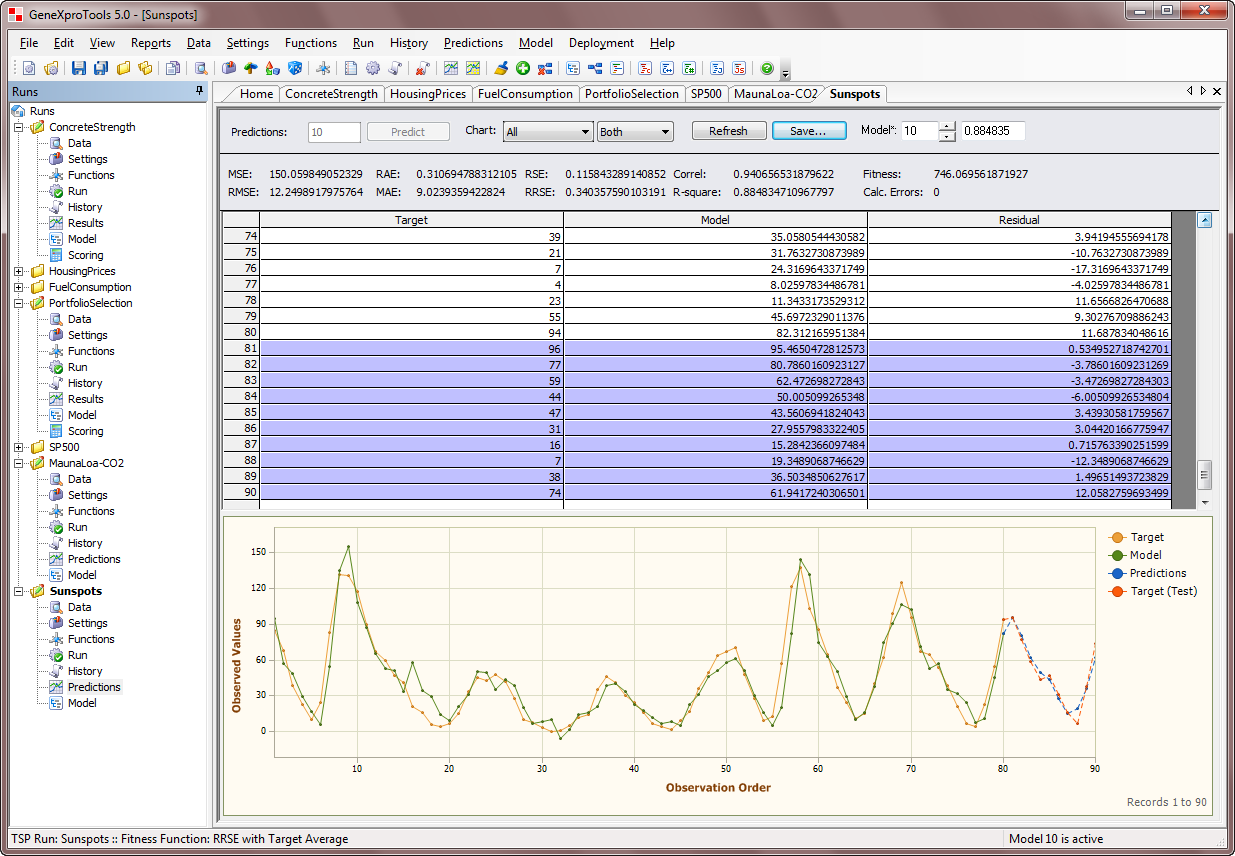
In the Predictions Panel is
where you use your models to make predictions about future
events in the Time Series Prediction Platform. Here is also where a thorough
statistical analysis of your models takes place and, if in
Testing Mode, it's also where you can test the predictive
accuracy on past historical observations.
|
Model Panel |
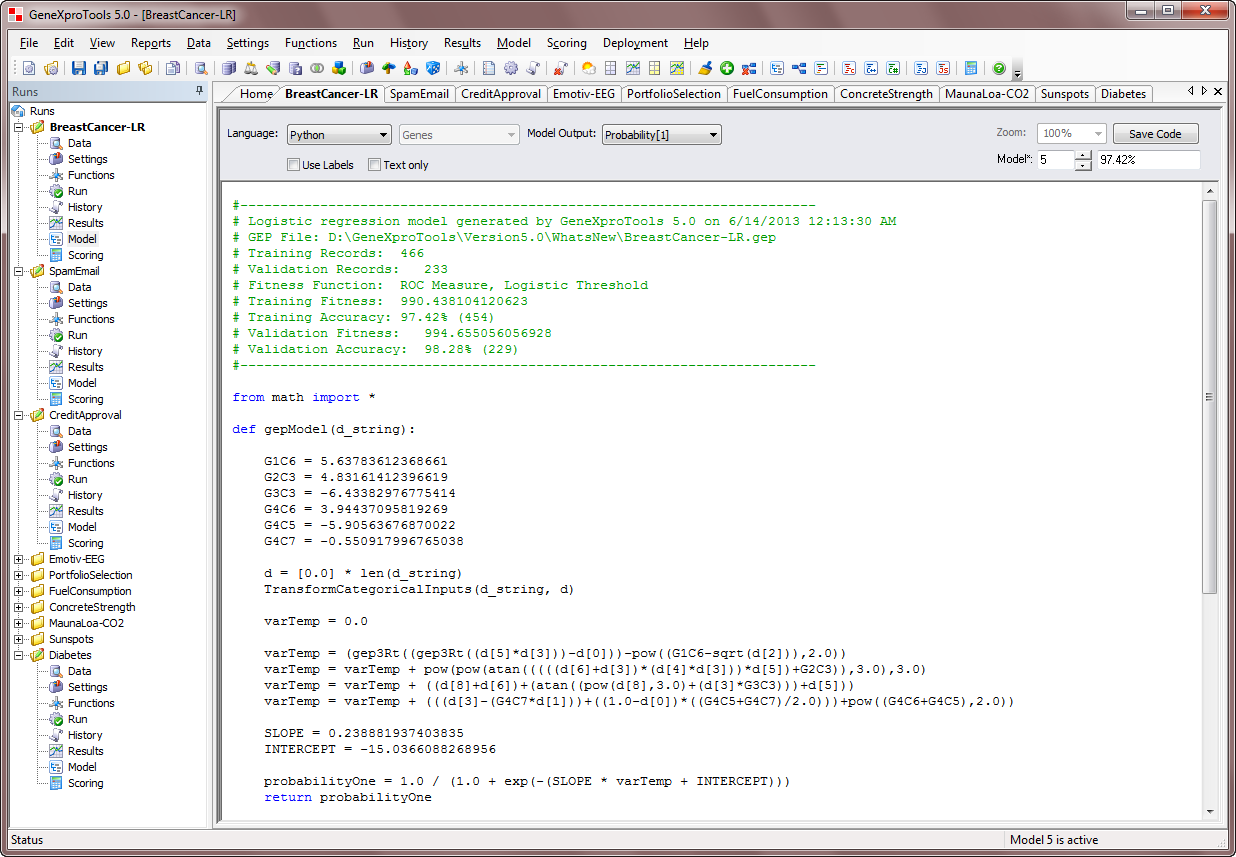
In the Model Panel you can see the mathematical/logical intricacies of the evolved models in
the universal representation of Expression Trees or automatically
translate the native Karva Code into several programming languages
(Ada, C, C++, C#, Excel VBA, Fortran, Java, JavaScript, Matlab, Octave,
Pascal, Perl, PHP, Python, R, Visual Basic, VB.Net, Verilog, and VHDL).
|
Scoring Panel |
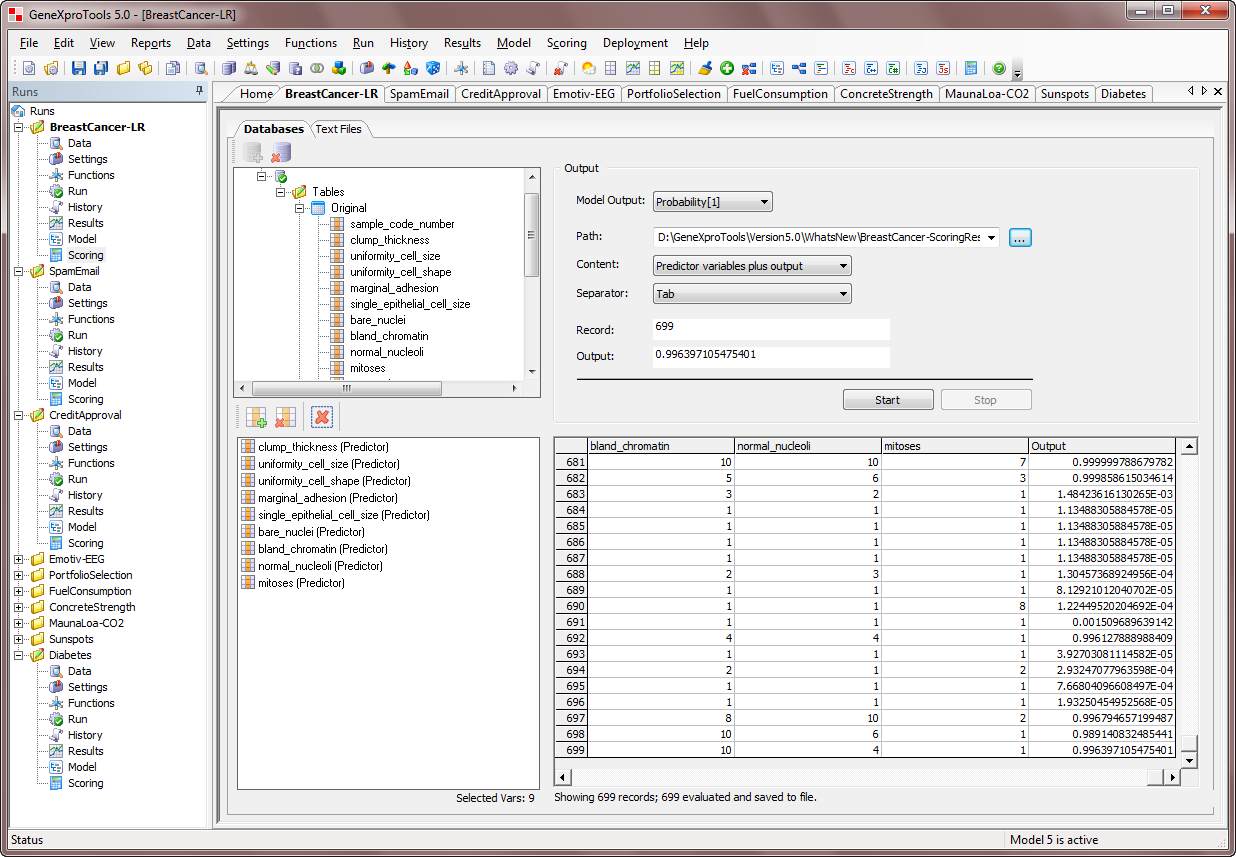
In the Scoring Panel you can
apply your models immediately without leaving the
GeneXproTools environment. The scoring engine of
GeneXproTools uses the JavaScript code of your models to score your
data. Both Excel/Databases and Text Files can
be scored and the output saved to Excel (csv) or text files. In addition, for small datasets, the output can
also be observed in its entirety in the Scoring Panel.
|